100 Scope Notes
SCROLL DOWN TO READ POSTS
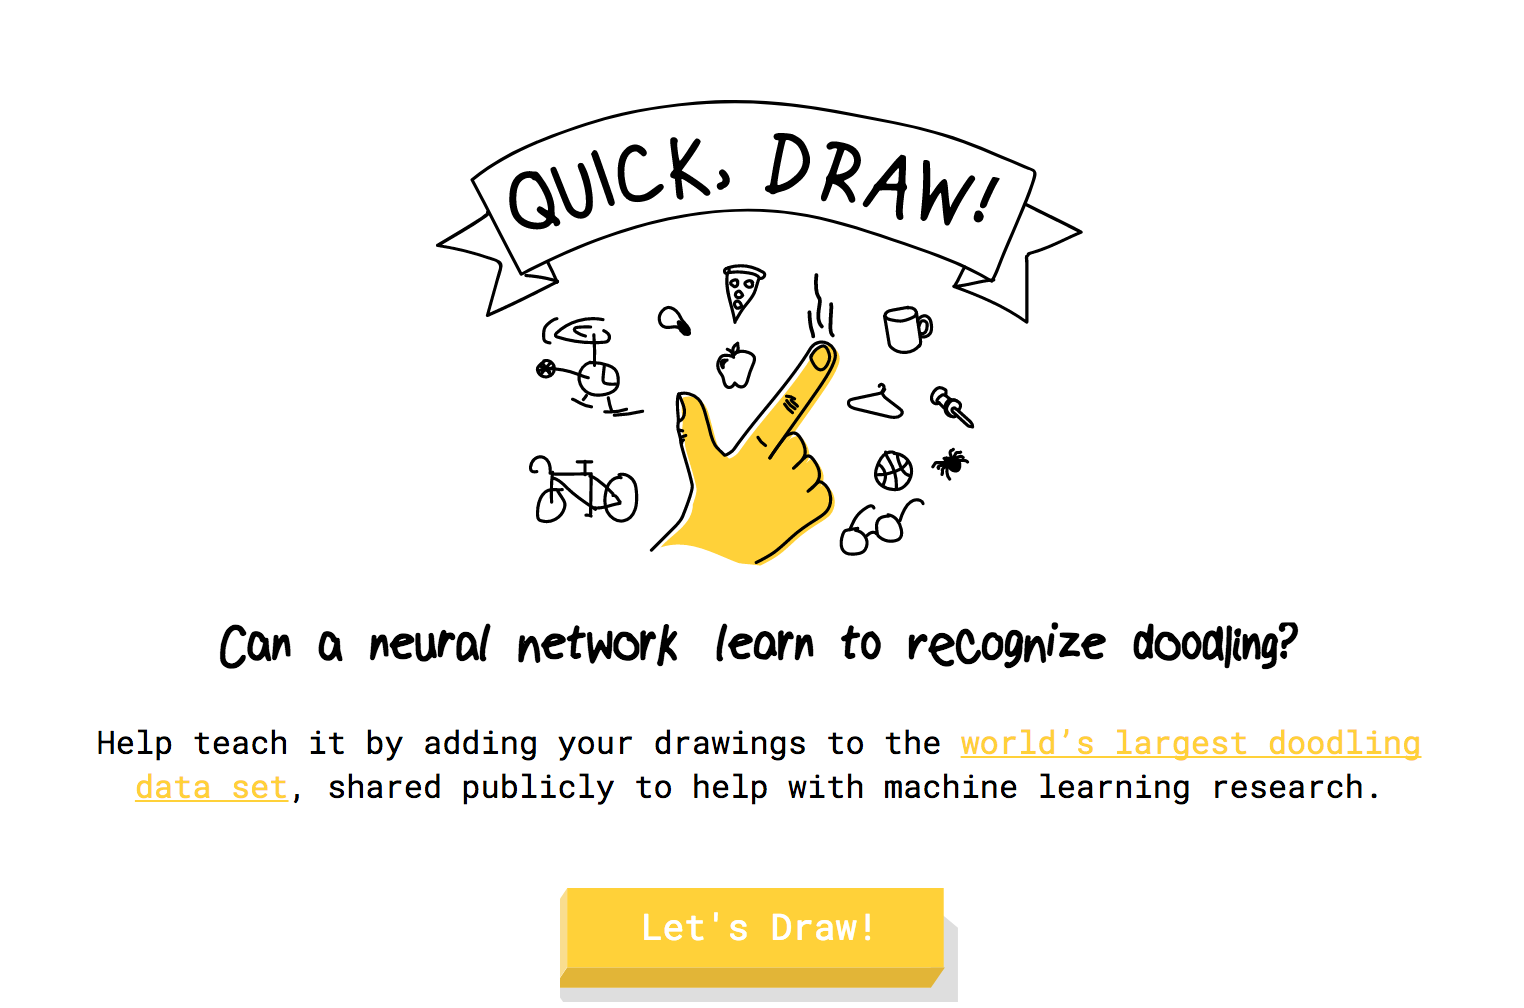
What Auto-Tune does for singers, Google’s AutoDraw AI experiment now does for those of us with limited visual talent. I’ve just discovered this handy tool and considering its power in demonstrating AI, as well as its affordances for so many everyday tasks. AutoDraw got its start as Quick Draw a Google game/experiment in which when you drew on your […]
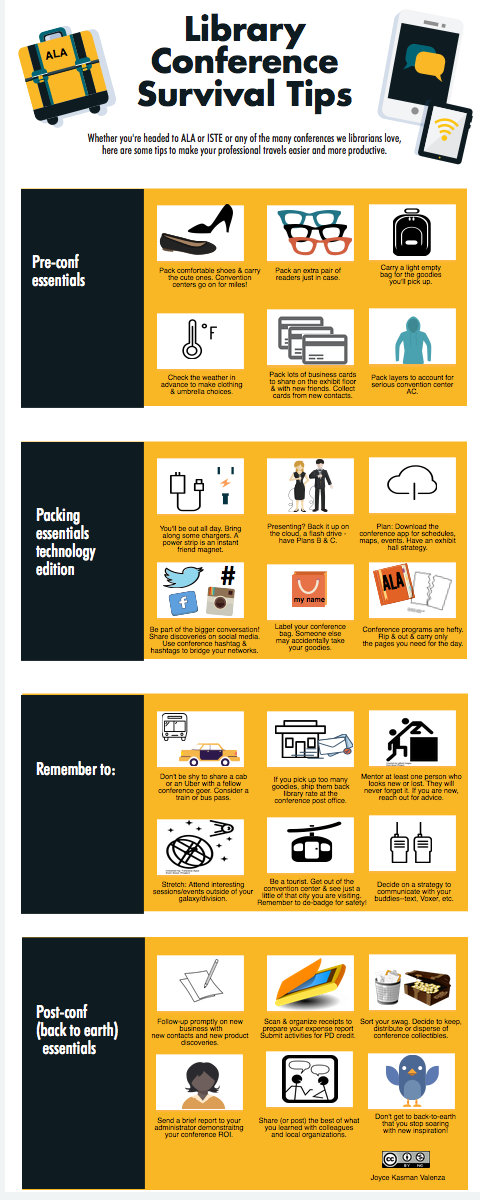
At this point in my travel career, I’ve learned a bit about how to do library conferences with fewer pain points. On the plane to ALA Orlando 2016, and at lunch in the hotel before I got my room, I shared my tips with a few friends who offered additional crowd-sourced advice. If conference travel […]

Earlier this week, Marcia Mardis, Chair of AASL’s Standards & Guidelines Editorial Board shared an update on their work on our Standards project. Our Standards for the 21st Century Learner debuted in 2007, followed in 2009 by Empowering Learners: Guidelines for School Library Programs, what Marcia calls a cornerstone of many school librarians’ practice. The […]
ADVERTISEMENT
There’s a whole lot of learning going on out there, but I’ve learned that it’s not all that easy to find. For the last few years I’ve tried to keep up with it myself and help my students and colleagues keep up as well. I decided it was time to pull it all together. Here’s […]
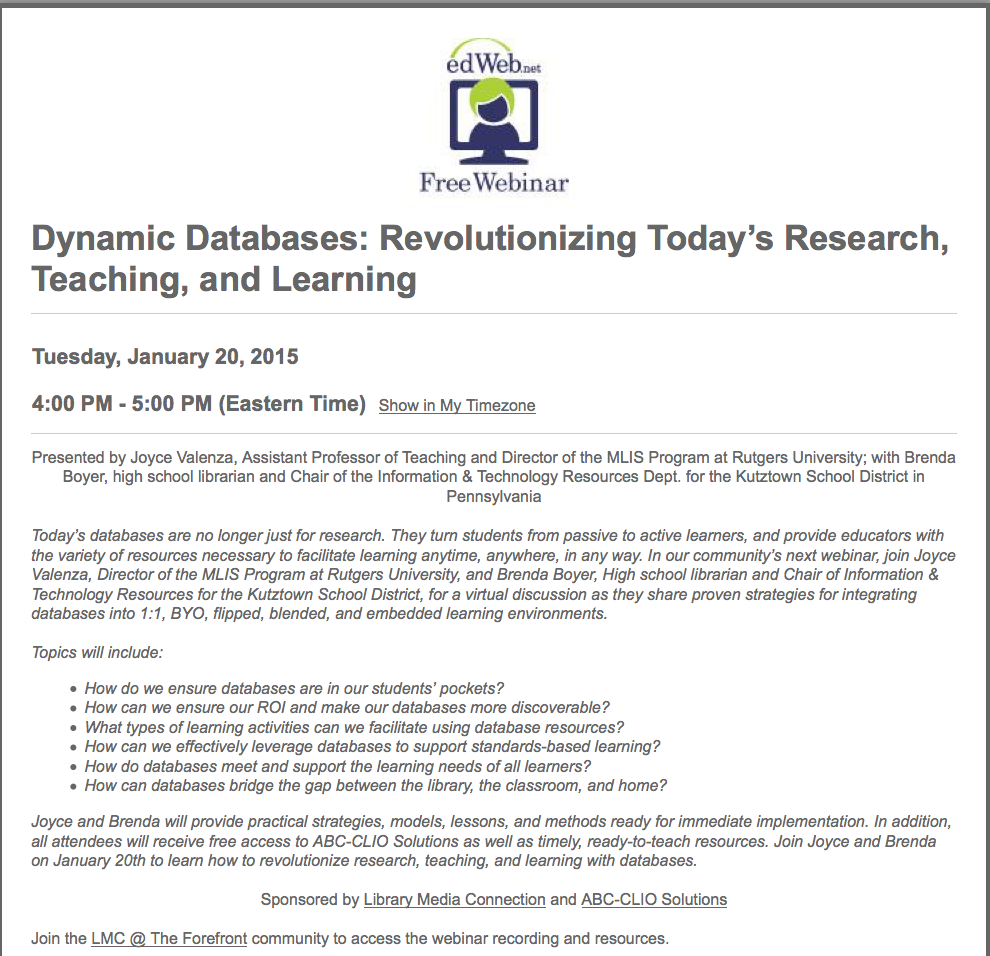
Brenda Boyer and I are getting ready for our edWeb webinar on use of subscription databases. In preparation, we created an infographic you may find useful in promoting databases with teachers and students. Please feel free to use and embed it if you find it helpful. Top reasons to use databases from Joyce Valenza During […]
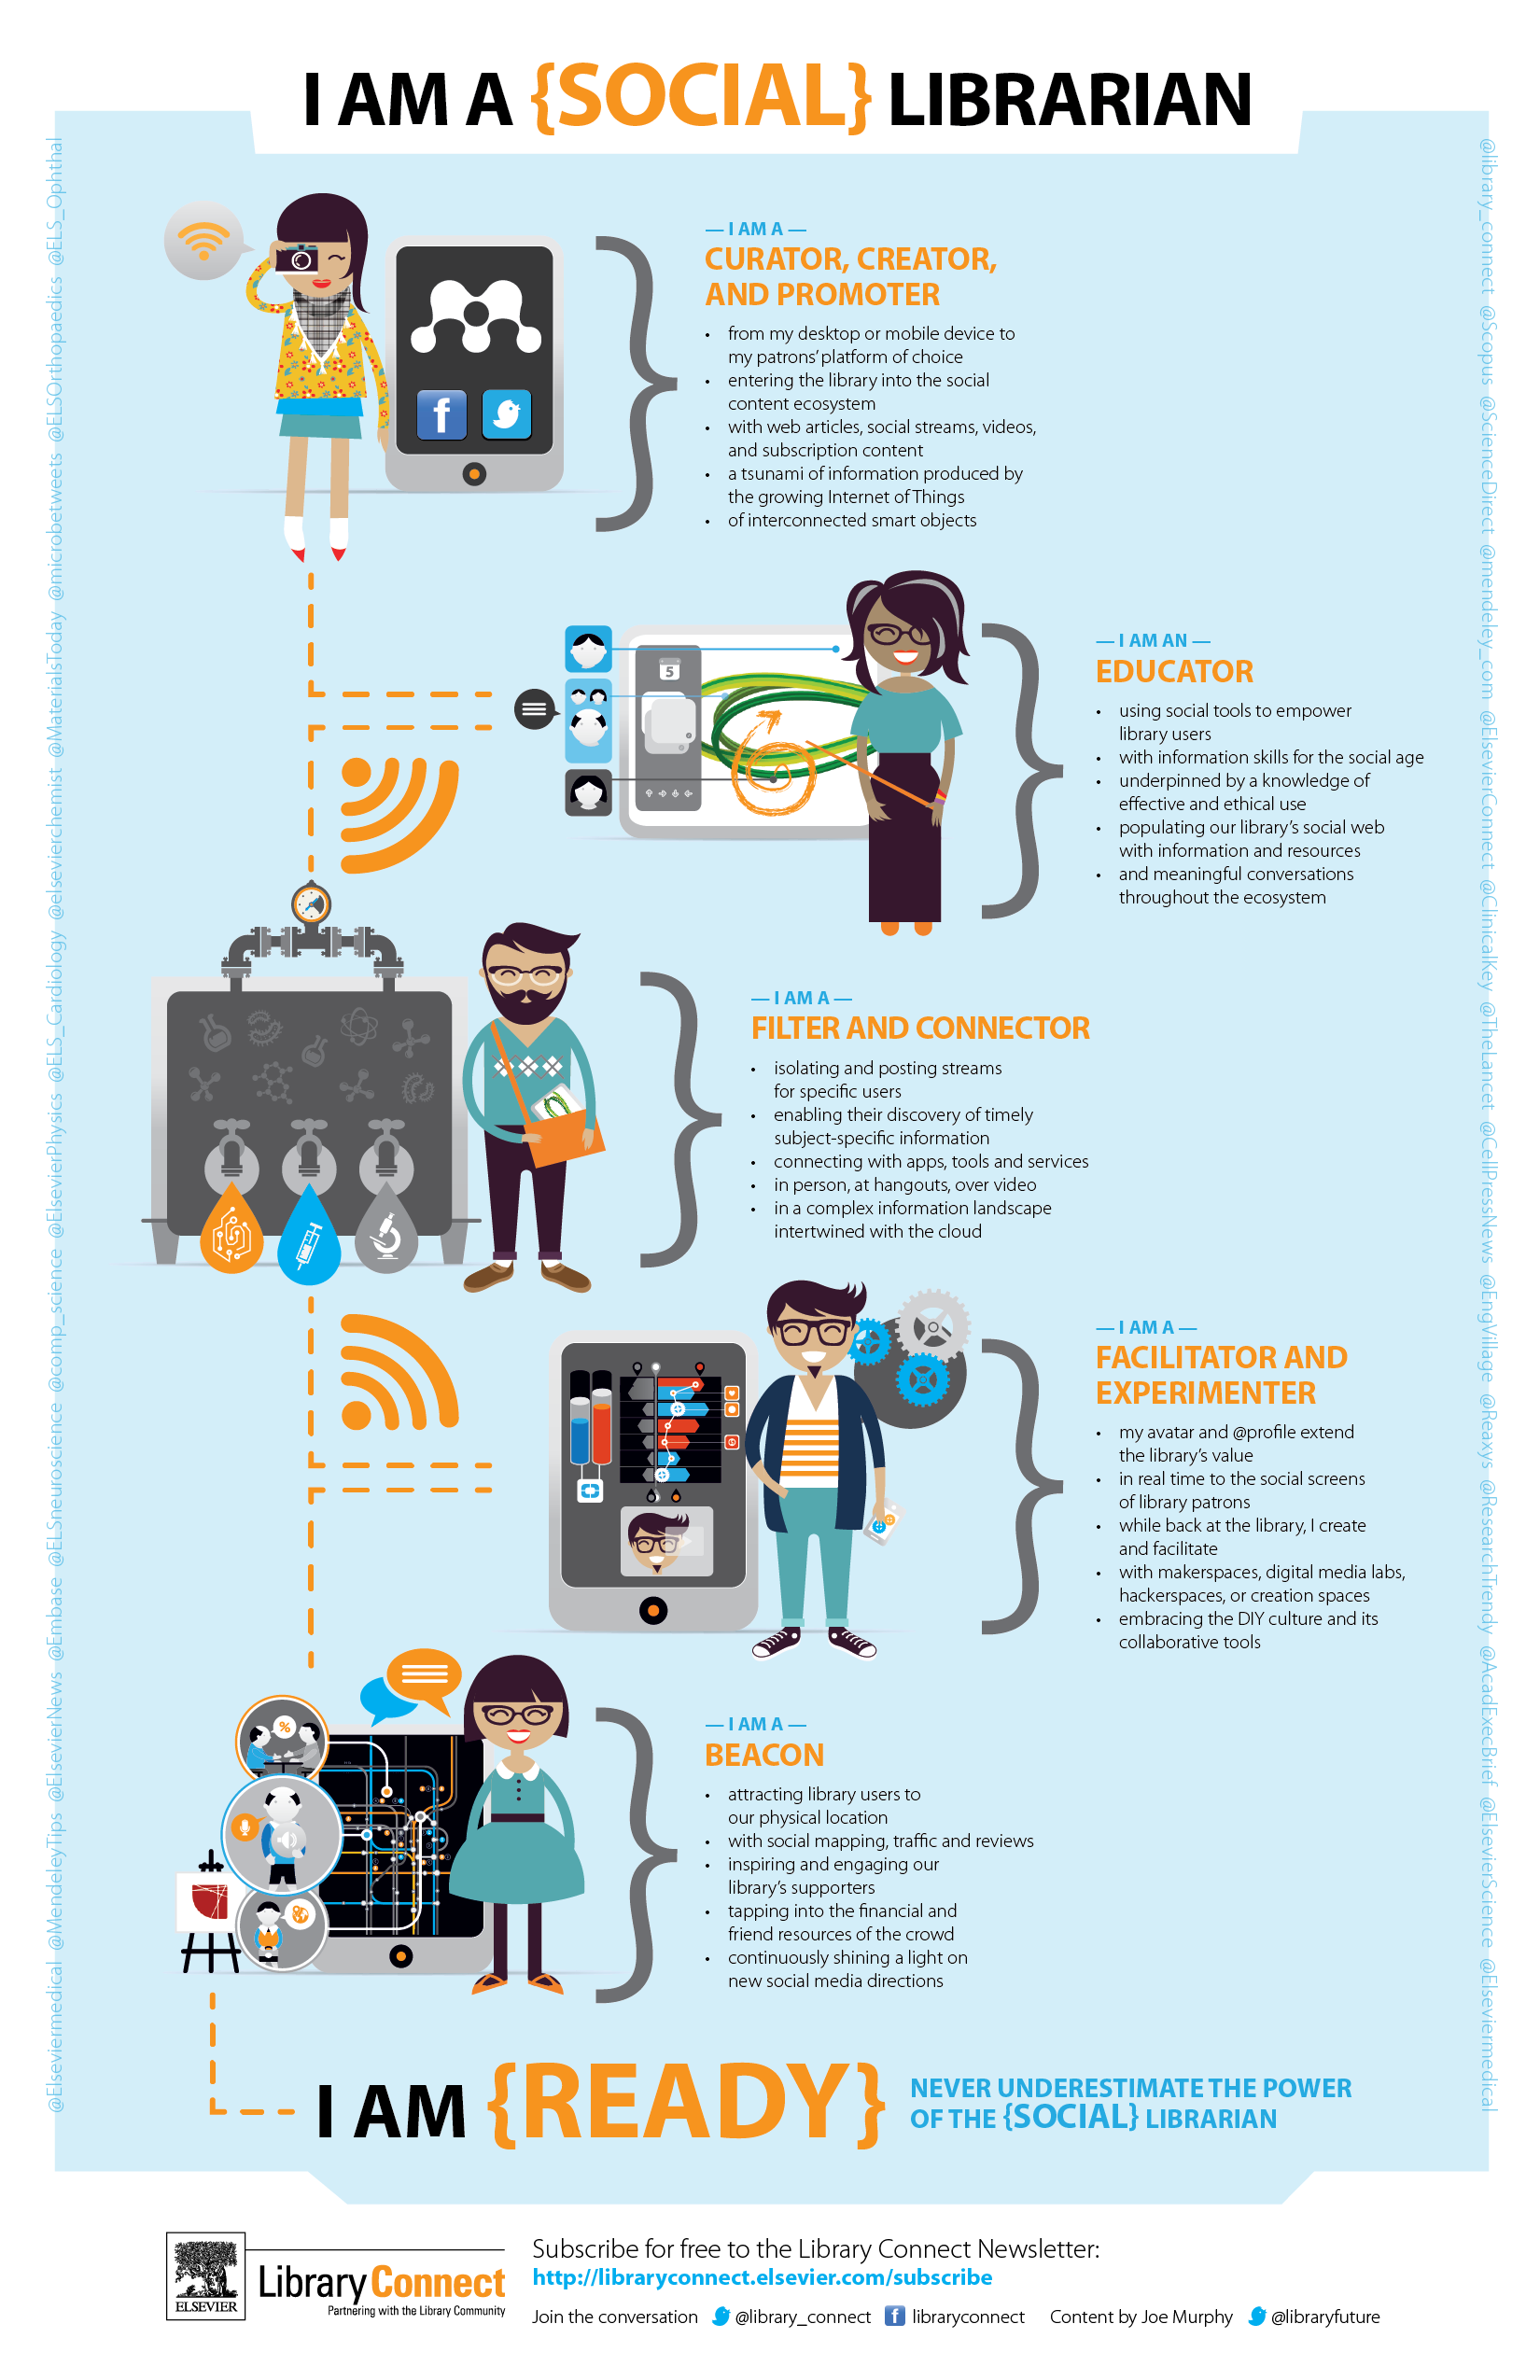
In case you missed it when it was posted in August, here’s a cool infographic published by the folks at Elsevier, that describes the way I see my position. The original post explained: Social today means so much more than sending a tweet or posting to Facebook. The social librarian is enmeshed in the fabric […]
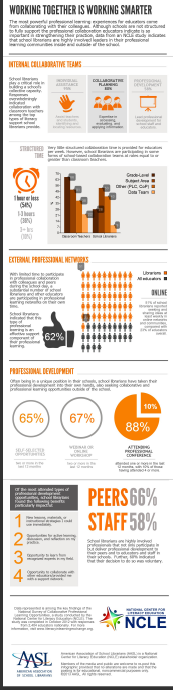
Based on a report recently released by the National Center for Literacy Education (NCLE), Working Together is Working Smarter, visually demonstrates the role of school librarians as highly involved leaders playing a critical role in their schools through consistent and sustained collaboration with other educators. The infographic reveals our dedicated, voluntary leadership in the delivery of […]
ADVERTISEMENT
ADVERTISEMENT